
Whether it is a Canvas app or a model-driven app, we need to have insights of how they are performing in real time. While we have code checker to perform static code analysis during development, it would also be great to have a tool which will give us the report of the real time performance of our apps so that we can take care of any issues which might be costing the app performance.
In this blog, I am going to briefly discuss two features in Preview introduced to PowerApps which we can use to analyse the performance of our PowerApps apps, be it canvas or a model-driven.
Analytics (Preview) for Canvas Apps
Analytics is now available in Public Preview to analyze the performance of the Canvas apps.
To start using it:
- Go to PowerApps portal.
- Open Apps and select any Canvas App.
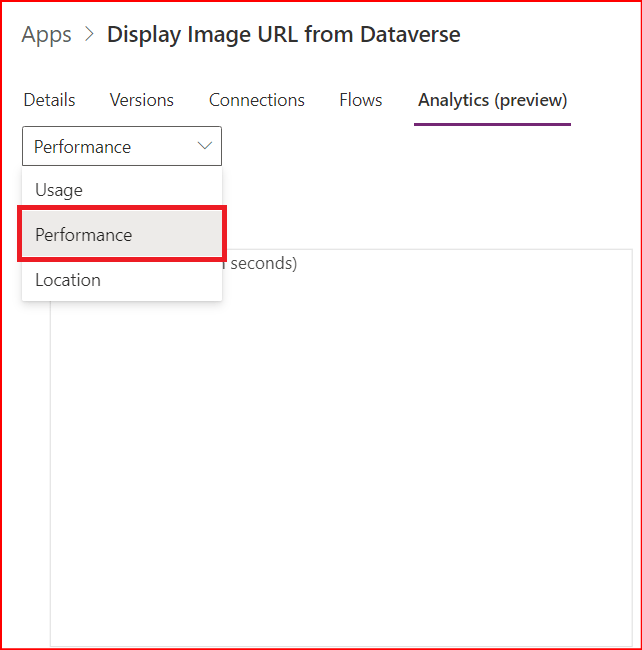
- From the contexual menu or command bar, select Analytics (Preview)

Select Performance and then you will be able to see the real time data.

These are like Power BI reports and you can simply export each tiles just as we do in Power BI reports.
Click on any tile and from the ellipse, select Export.

Performance Insights (Preview) for Model-Driven Apps
Performance Insights is a self-service tool for enterprise app makers that analyzes runtime user data and provides a prioritized list of recommendations to help improve the performance of Model-driven apps. With this feature, raw telemetry data are converted into actionable work items. For more information, please refer to this blog.
To start using it:
- Go to PowerApps portal.
- Open Apps and select any Model-Driven App.
- From the contexual menu or command bar, select Performance (Preview)


This way we can learn what is causing certain issues in our apps and how we can tackle them based on the recommendations.
More Reources about the Performance Insights here.
Thank you for being here. See you in the next blog.

Leave a comment